13F Filings: The Basics
"I believe in the discipline of mastering the best that other people have ever figured out. I don't believe in just sitting down and trying to dream it all up yourself. Nobody's that smart." — Charlie Munger
In 2016, Warren Buffett began buying Apple stock. The prevailing narrative was "Peak Apple" — iPhone sales growth had stalled, international sales were slowing, and headlines questioned whether the company's best days were behind it. Buffett kept buying. Quarter after quarter, his 13F filings revealed a growing position that eventually became Berkshire Hathaway's single largest holding.
The thesis was hiding in plain sight: Apple was transitioning from a hardware company to a services ecosystem with deeply entrenched customers. By 2025, Apple stock had risen nearly 10x from its 2016 lows.
How did investors tracking Buffett know this was happening? They were reading his 13F filings.
What is a 13F filing?
A 13F is a quarterly snapshot of a manager's portfolio. Any investment manager controlling more than $100 million in qualifying U.S. securities must file Form 13F with the SEC, disclosing every qualifying position they held on the last day of the quarter.
Several thousand managers file 13Fs. Tradetheon tracks over 100 of them, selected for their long-term track records and relevance to fundamental investors.
Going deeper
The $100 million threshold applies to the aggregate fair market value of "Section 13(f) securities" under management. These include U.S. exchange-listed equities (common and preferred), equity options and warrants (exchange-listed), shares of closed-end funds and ETFs, certain convertible debt securities (only those on the SEC's Official List), and certain equity-linked bonds. Notably excluded: regular corporate and government bonds, mutual fund shares, foreign securities not listed on U.S. exchanges, and private placements. The SEC publishes an updated Official List quarterly.[1]
What's in a 13F?
Each line in a filing represents one position:
- The security: identified by CUSIP (a 9-character ID), company name, and whether it's common stock or convertible bond, a put or a call
- The value: the dollar amount of the holding as of quarter-end
- The shares: the number of shares held (or principal amount for bonds)
The filing also includes fields for voting authority (sole, shared, or none), investment discretion, and other manager information for multi-manager filers — but these are less relevant for most investment research and Tradetheon typically omits them.
No purchase date, no cost basis, no rationale.
⚠️ Caveat: Reported prices and data quality
Because the filing reports total value and shares, you can derive an implied price per share by dividing one by the other. This should approximate the security's market price on the last day of the quarter — it is not the price the manager actually paid when they bought or sold.
Managers make errors in their filings more often than you'd expect — misplaced decimals, values reported in the wrong scale, incorrect CUSIPs, and even mislabeling bonds as stocks or vice versa. The SEC explicitly makes no guarantees about the accuracy of 13F data.[2] Tradetheon applies data cleaning to normalize detectable inconsistencies where possible, but the source filings remain the authority for any given position. For critical research, verify directly against the SEC filing.
Where the insight comes from: change over time
A single filing is a photograph. A sequence of them is a film.
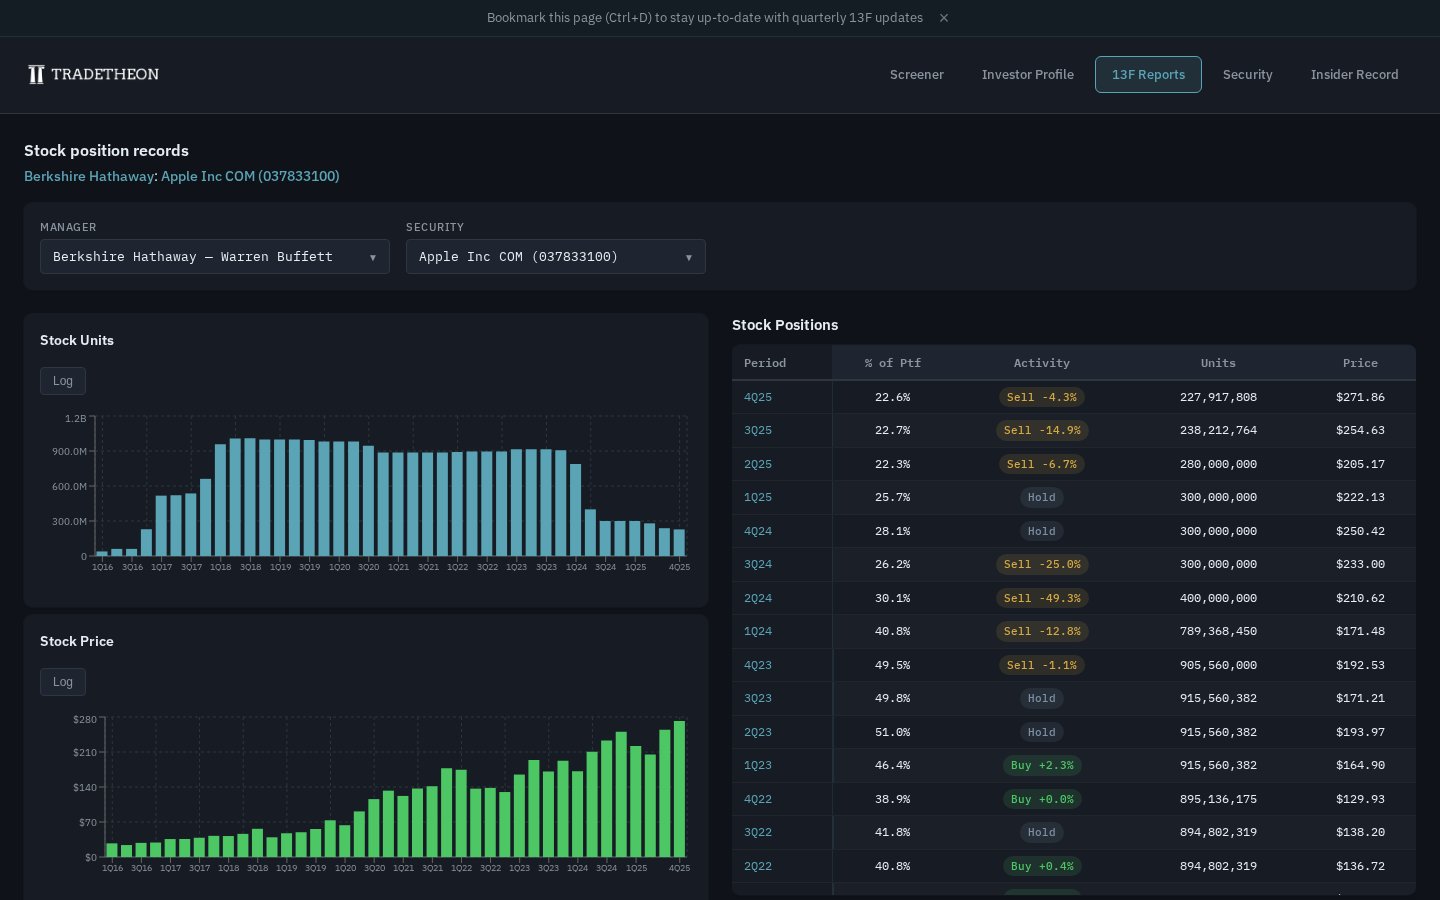
Consider how Berkshire Hathaway's Apple position evolved from 2016 onward. You can trace this yourself on Berkshire's manager-security page:
| Quarter | Position Type | What it tells you |
|---|---|---|
| Q1 2016 | Entry | Berkshire initiated a brand-new Apple position |
| Q2 2016 | Buy | Shares increased — accumulation underway |
| Q3 2016 | Buy | Still adding despite "Peak Apple" sentiment |
| Q4 2016 | Buy | Conviction growing — position nearly quadrupled in three quarters |
Tradetheon computes these labels by comparing the current filing to the previous one, for every position, for every manager, going back to 2013:
- Entry: the stock appears for the first time — the manager initiated a new position
- Buy: share count increased — the manager added
- Hold: share count unchanged
- Sell: share count decreased — the manager trimmed
- Exit: the position disappeared entirely — the manager sold everything
Going deeper
Exit rows are not reported directly in filings. Tradetheon infers an exit from the absence of a security that was present in the previous quarter's filing. Since there's no reported exit price, we estimate it using peer managers' reported prices from that quarter or carry forward the last available price.
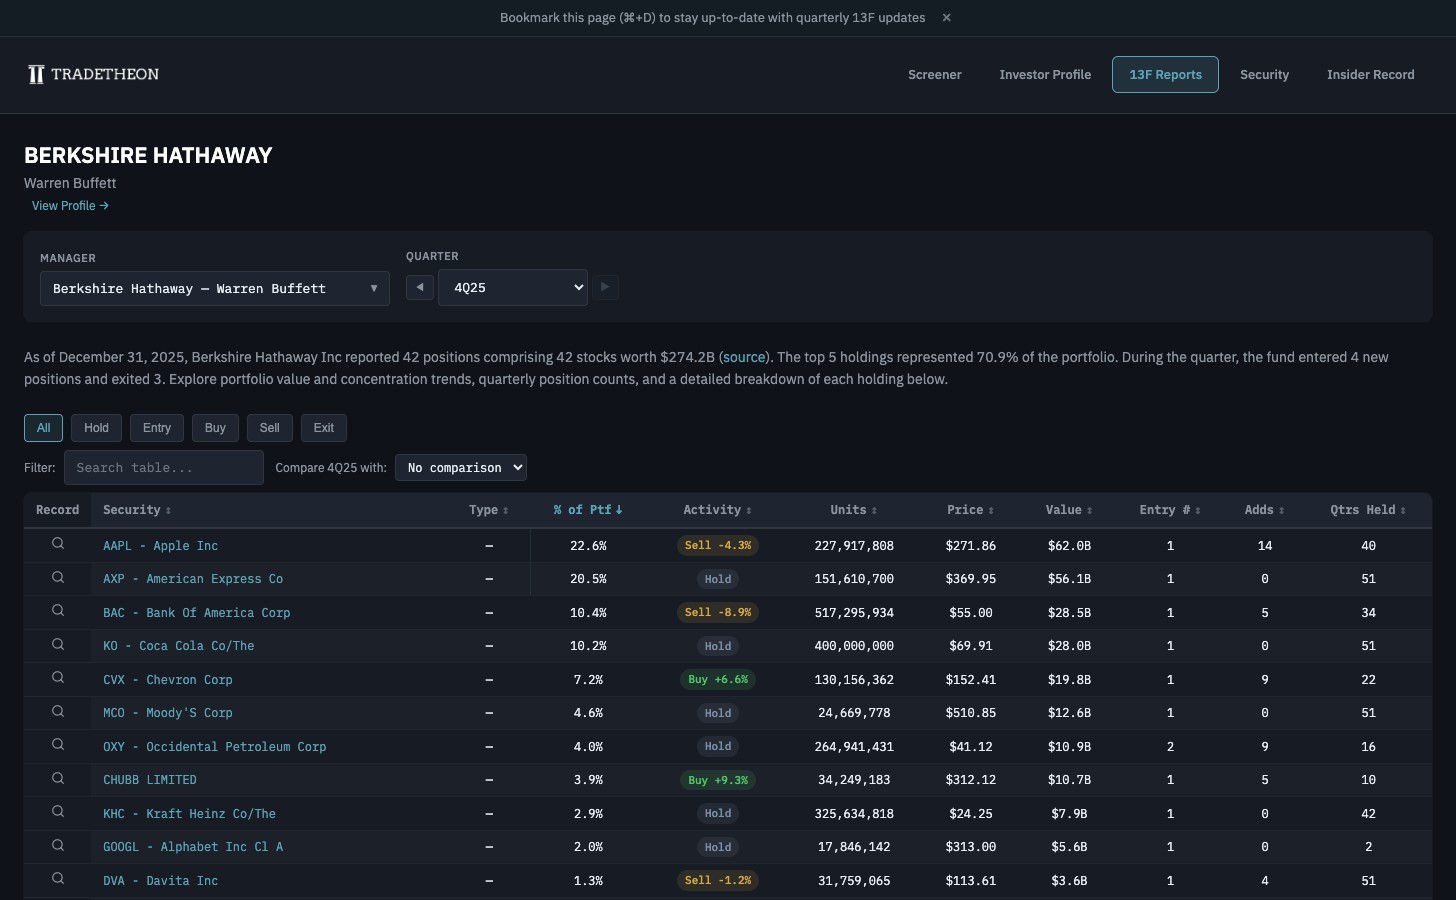
The Manager Holdings page
The manager-security page above shows a single position's evolution over time. The manager holdings page flips the view: a full portfolio snapshot for a specific quarter, with every position tagged by activity type.
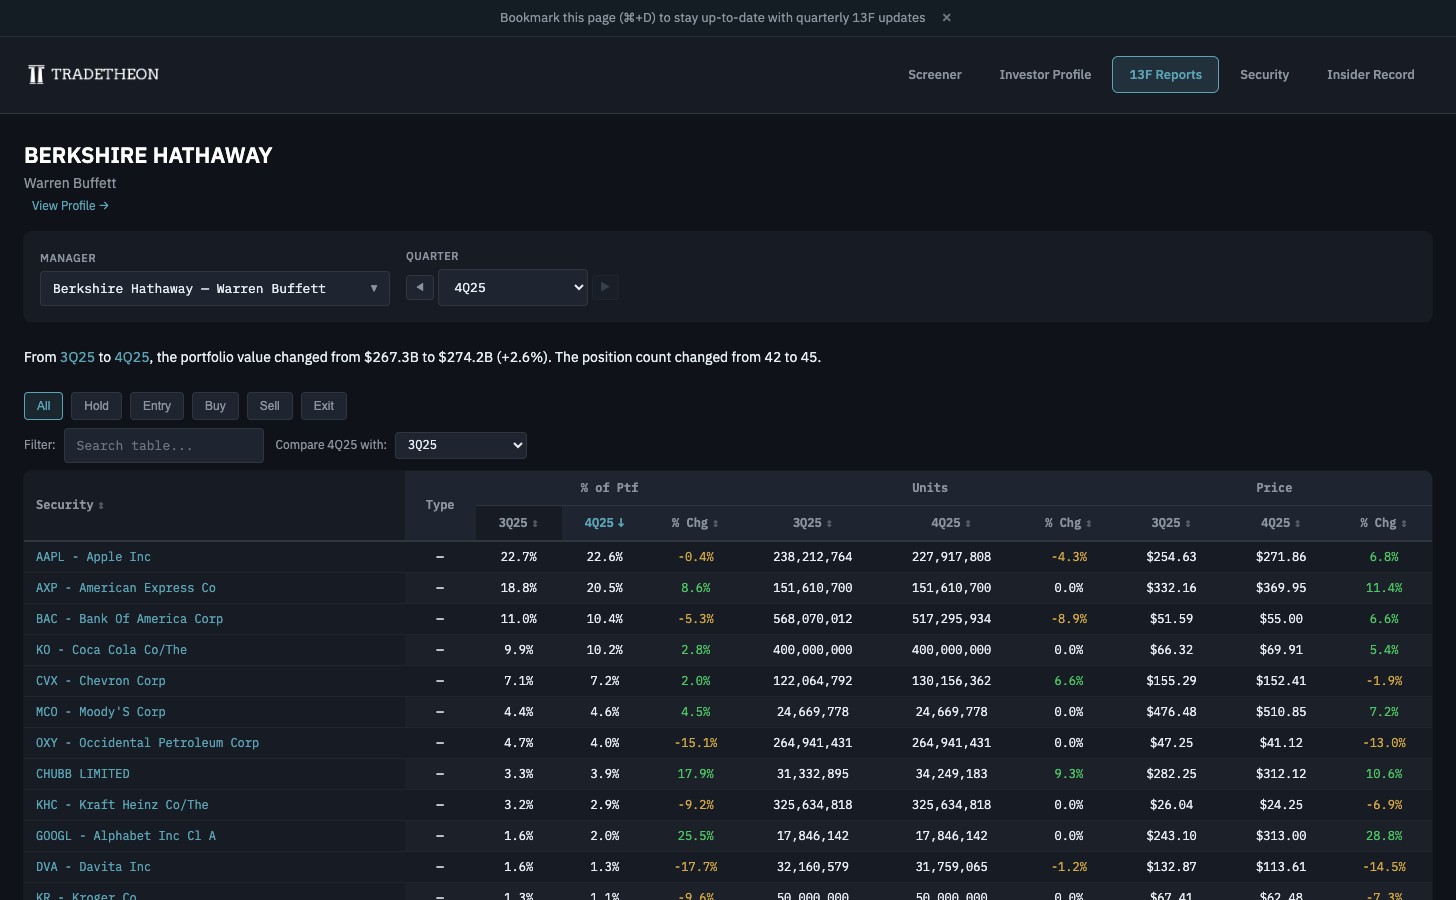
The page also supports a compare mode, which places two quarter-ends side by side so you can immediately see what changed between periods — new entries, exits, and sizing adjustments — without flipping between pages.
Aggregate activity charts
Beyond individual positions, the holdings page includes three aggregate charts that give you a quick read on whether a manager is in an accumulation phase, a distribution phase, or holding steady.
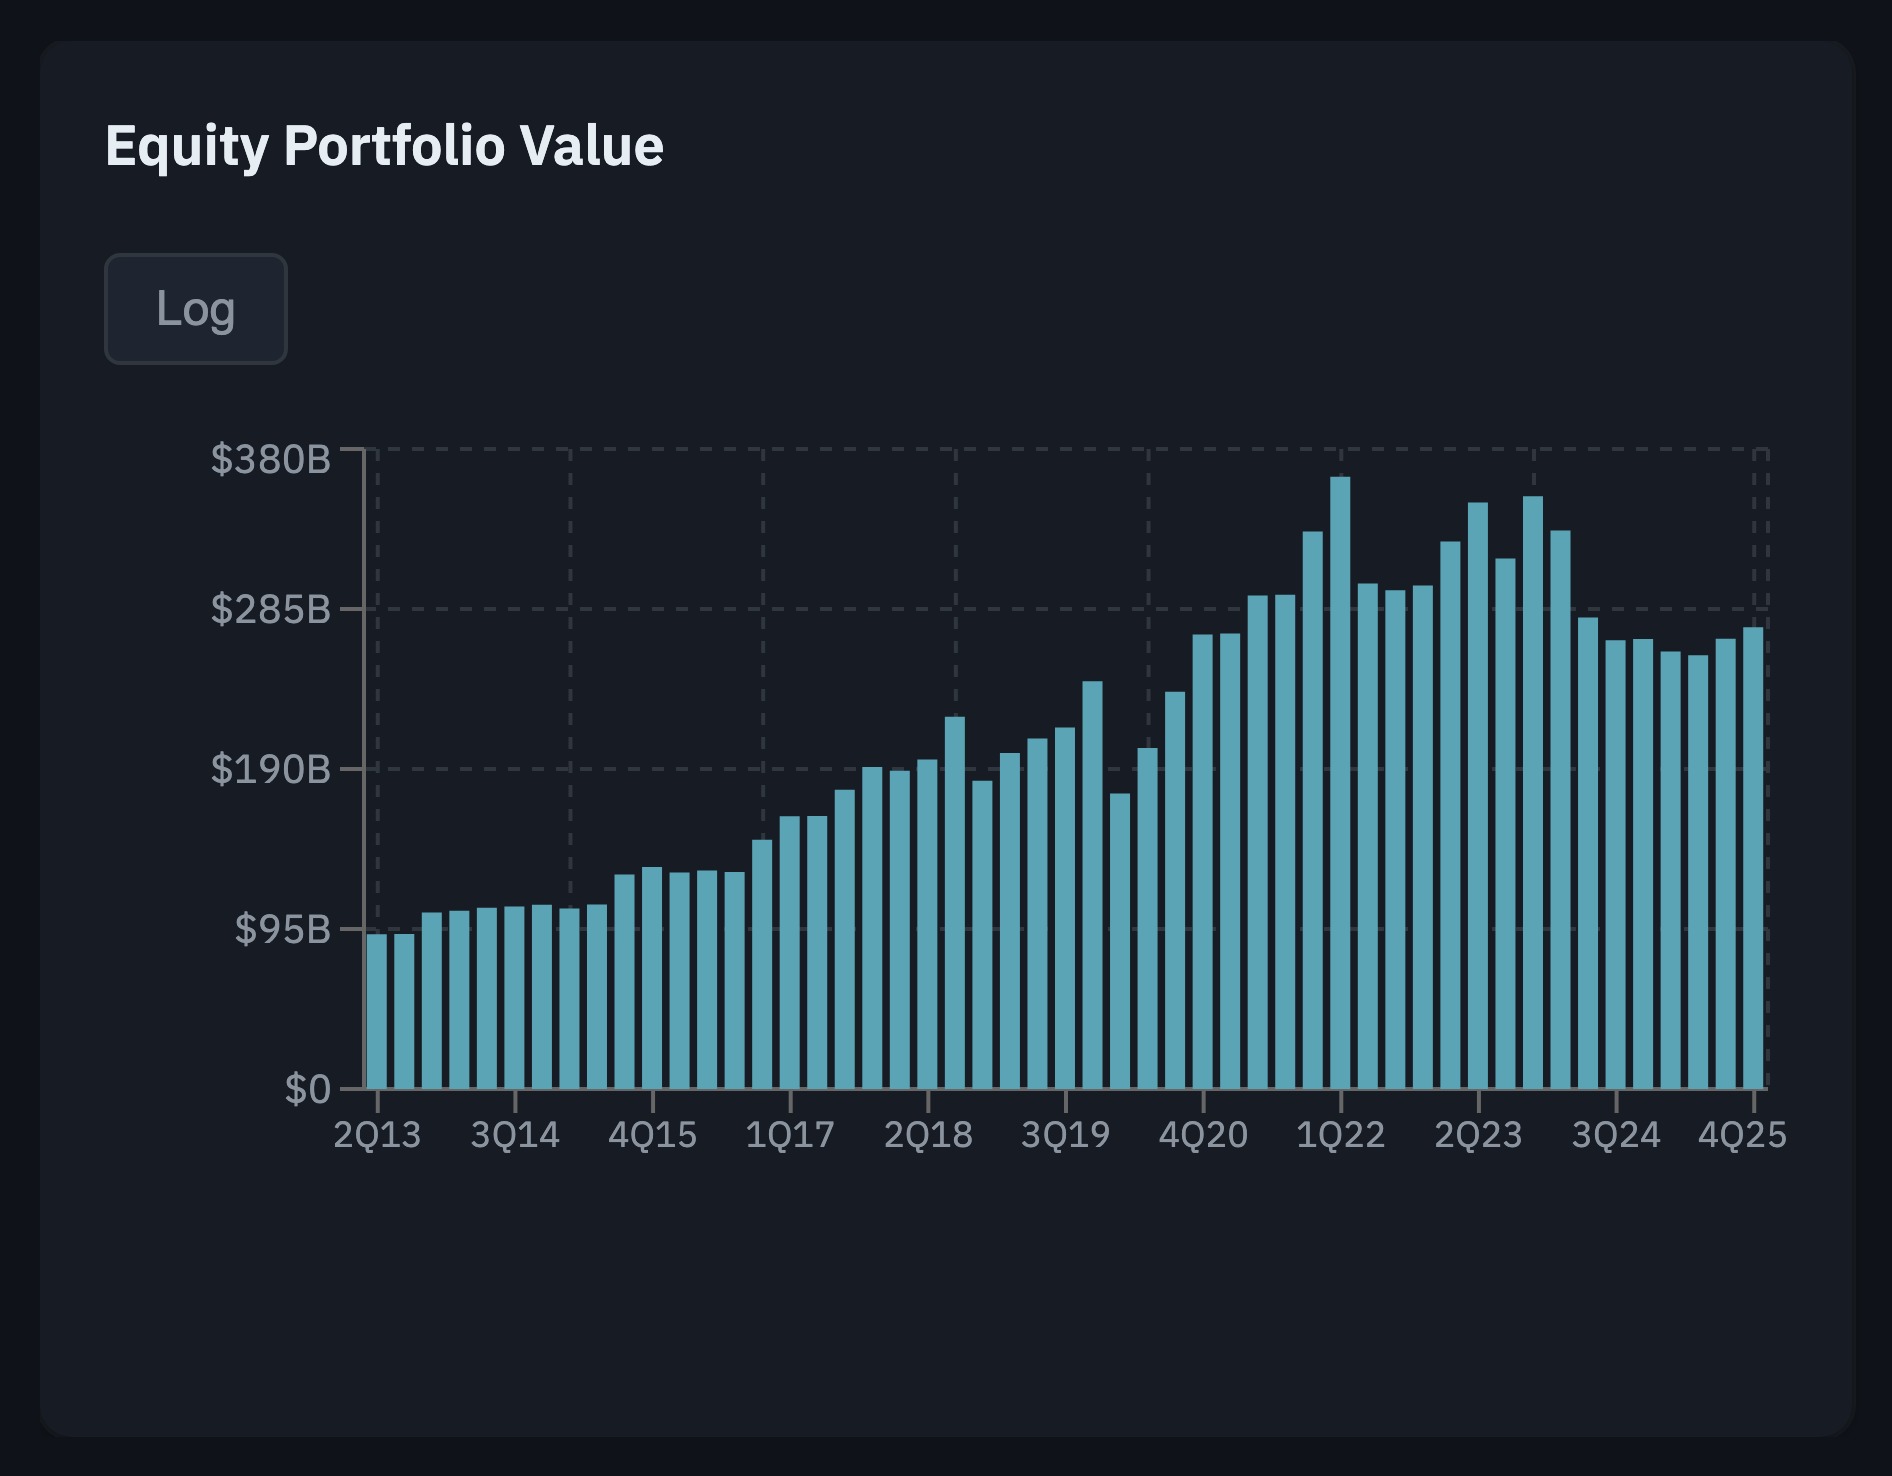
Equity Portfolio Value
The total dollar value of all U.S. equity positions, quarter by quarter. This shows the manager's total exposure across cycles. Berkshire's chart traces a steady climb from ~$95B in 2013 to a ~$380B peak in 1Q22 — the Apple accumulation drives much of the 2016–2018 ramp — followed by a partial unwind into 2024–2025 as Buffett sold down Apple and let cash accumulate.
Keep in mind that the value can rise even when the manager isn't buying — price appreciation alone can lift a steady book. To distinguish flow from price action, read this chart alongside the Portfolio Count by activity type chart below: if the value chart climbs but the count chart shows mostly holds, the gain came from prices, not new buying.
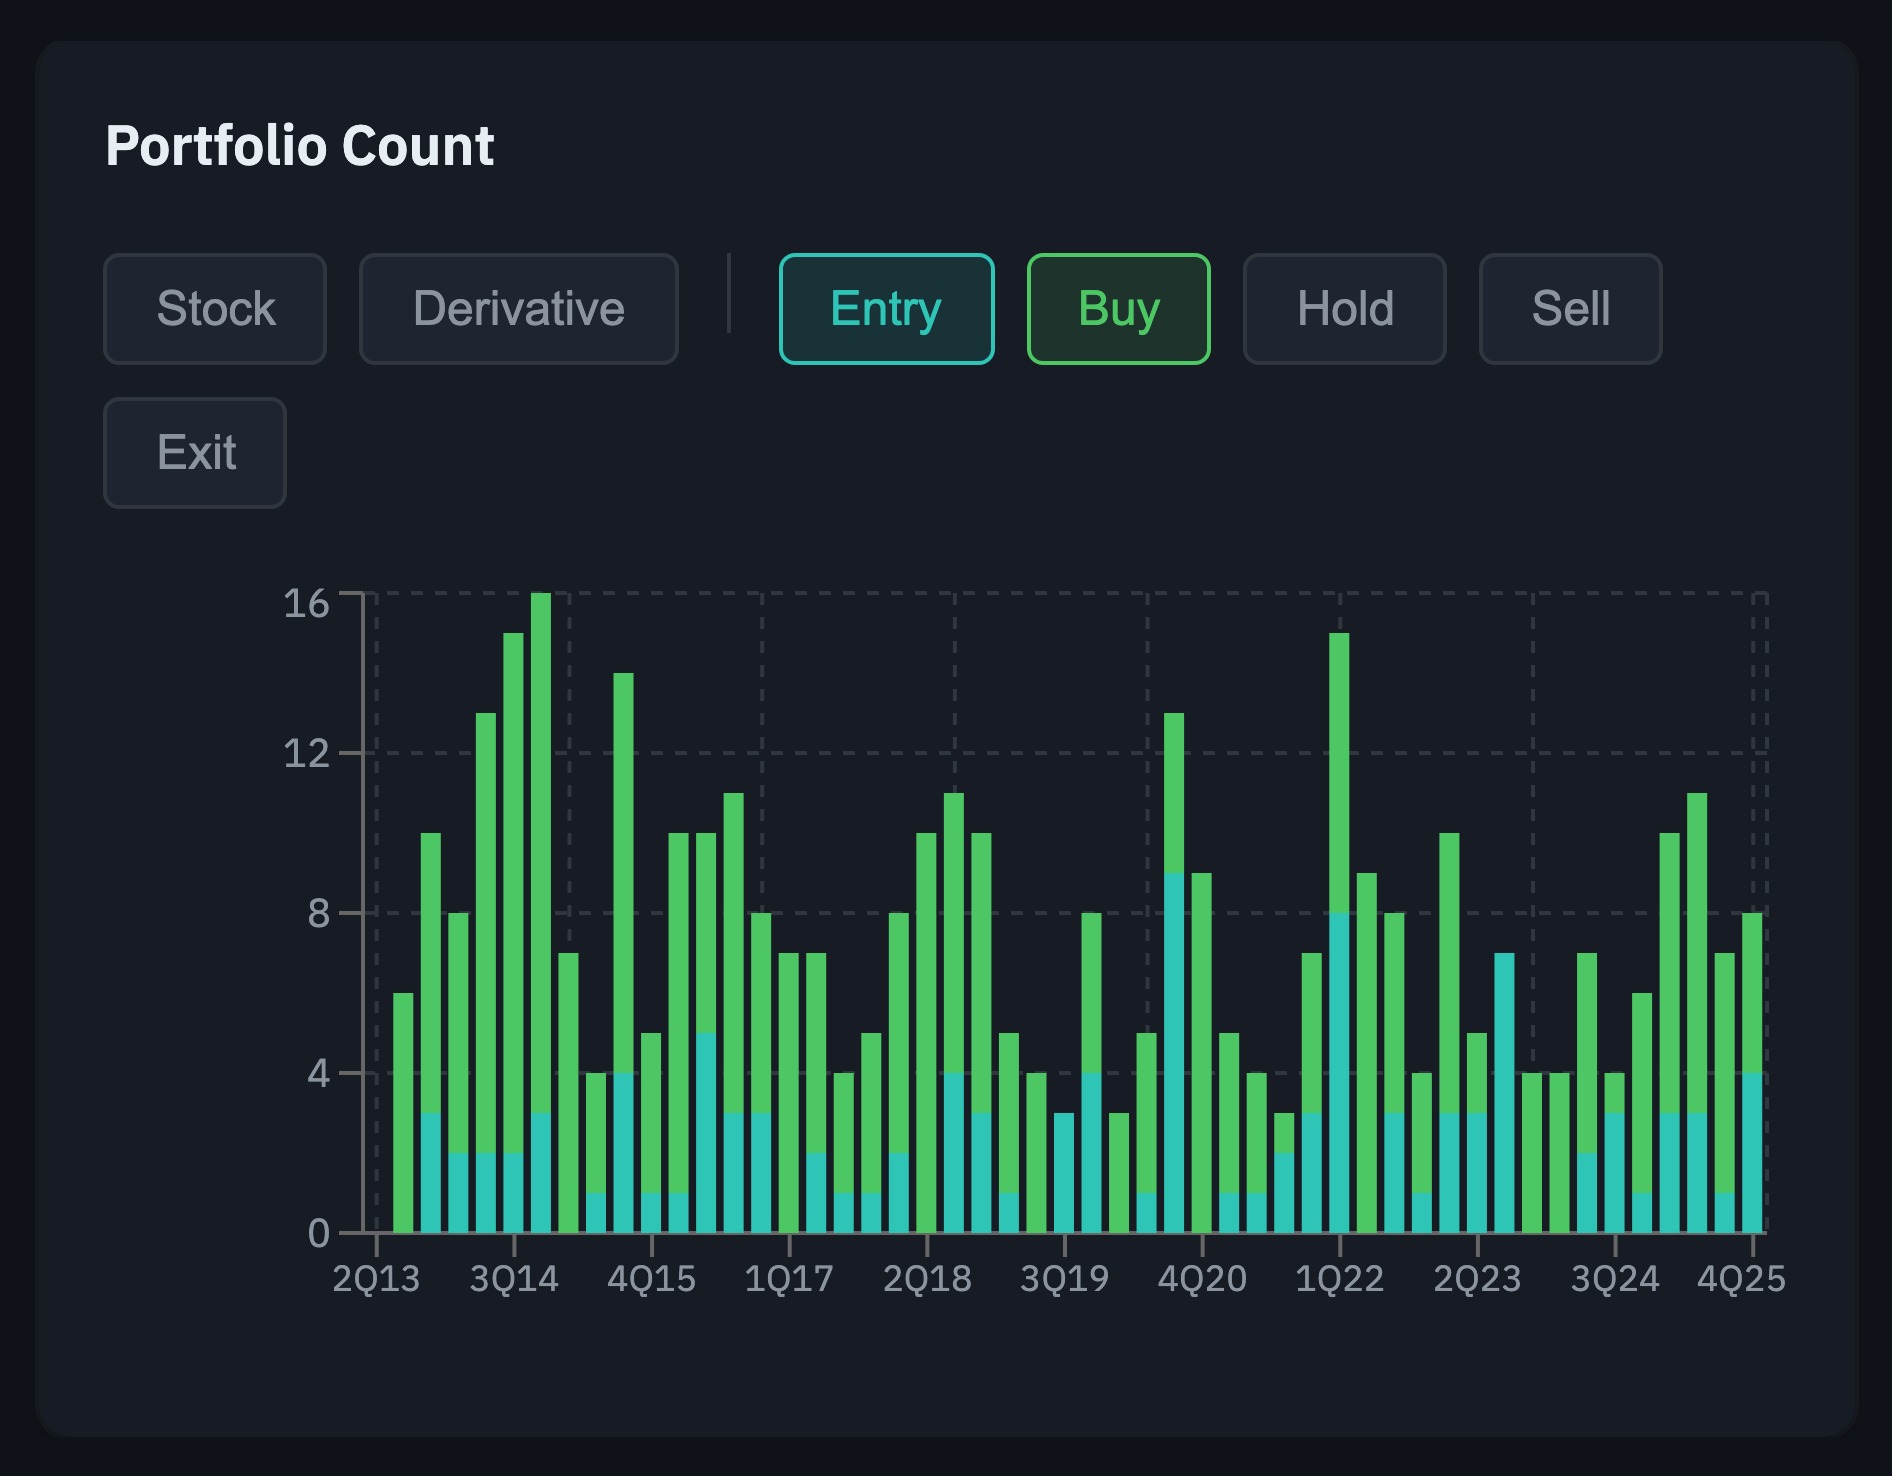
Portfolio Count by activity type
A stacked bar count of how many positions were entered, added, held, trimmed, or exited each quarter. The bars are color-coded: buy (green) and entry (teal) mark accumulation phases — a manager actively building. Sell (yellow) and exit (red) mark distribution. A bar dominated by gray (hold) tells you the manager is sitting tight.
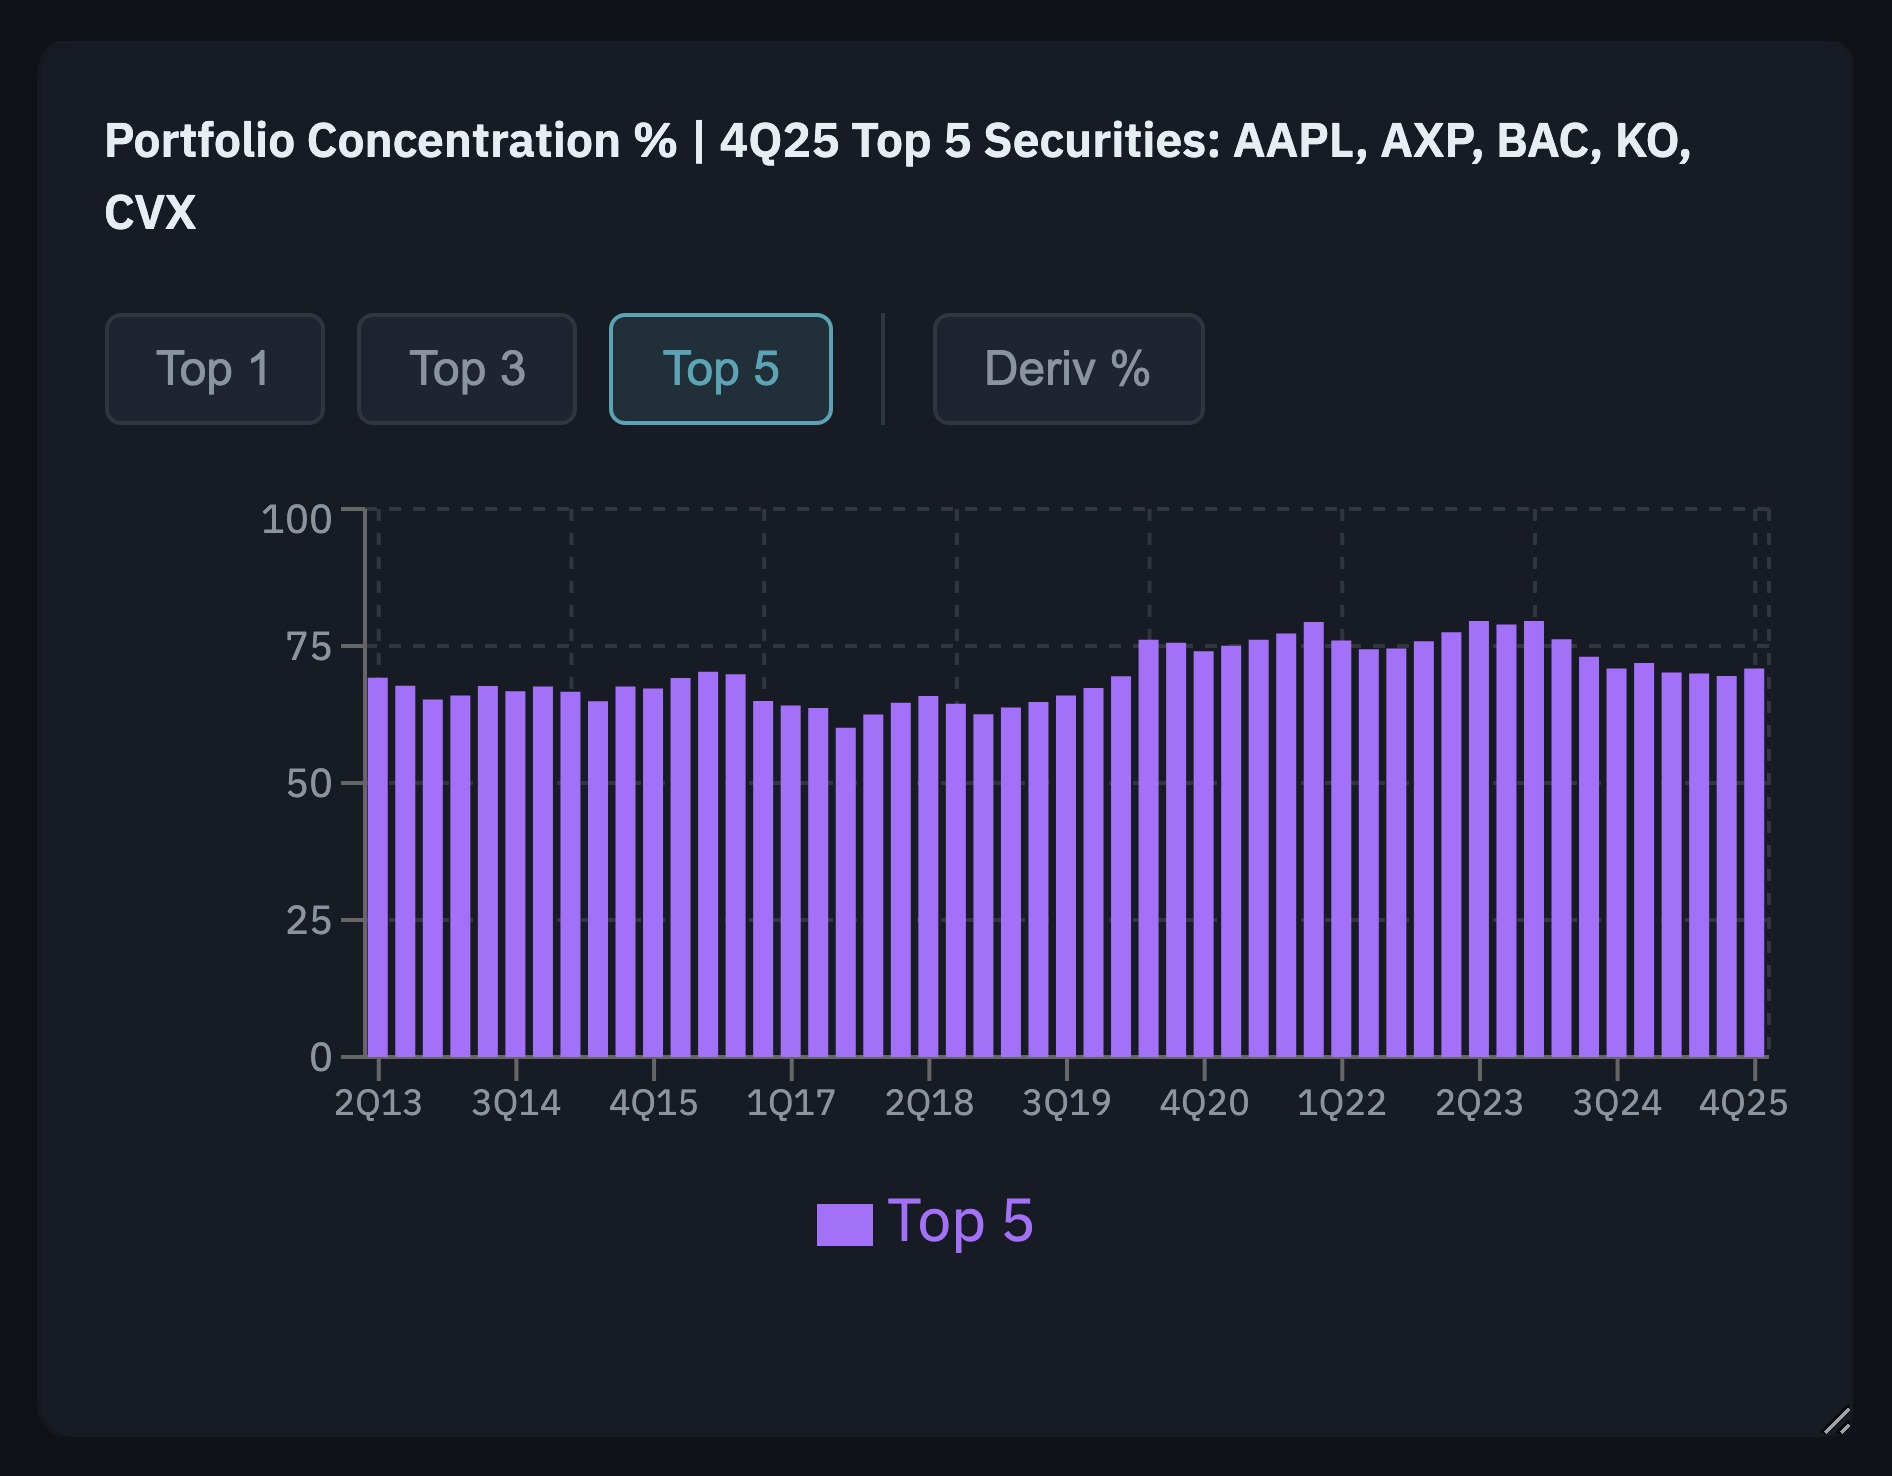
Portfolio concentration
The percentage of the portfolio held in the top 1, top 3, and top 5 positions, plus the share held in options. A high top-1 concentration indicates a manager with strong conviction in a single name; a rising options share is often a hedging signal. Berkshire has run with an unusually high top-1 weight since the Apple position grew dominant in 2018.
Who else owns this stock?
The holdings page shows you one manager's portfolio. The security analytics page flips the question: pick any stock and see every tracked manager who holds it.
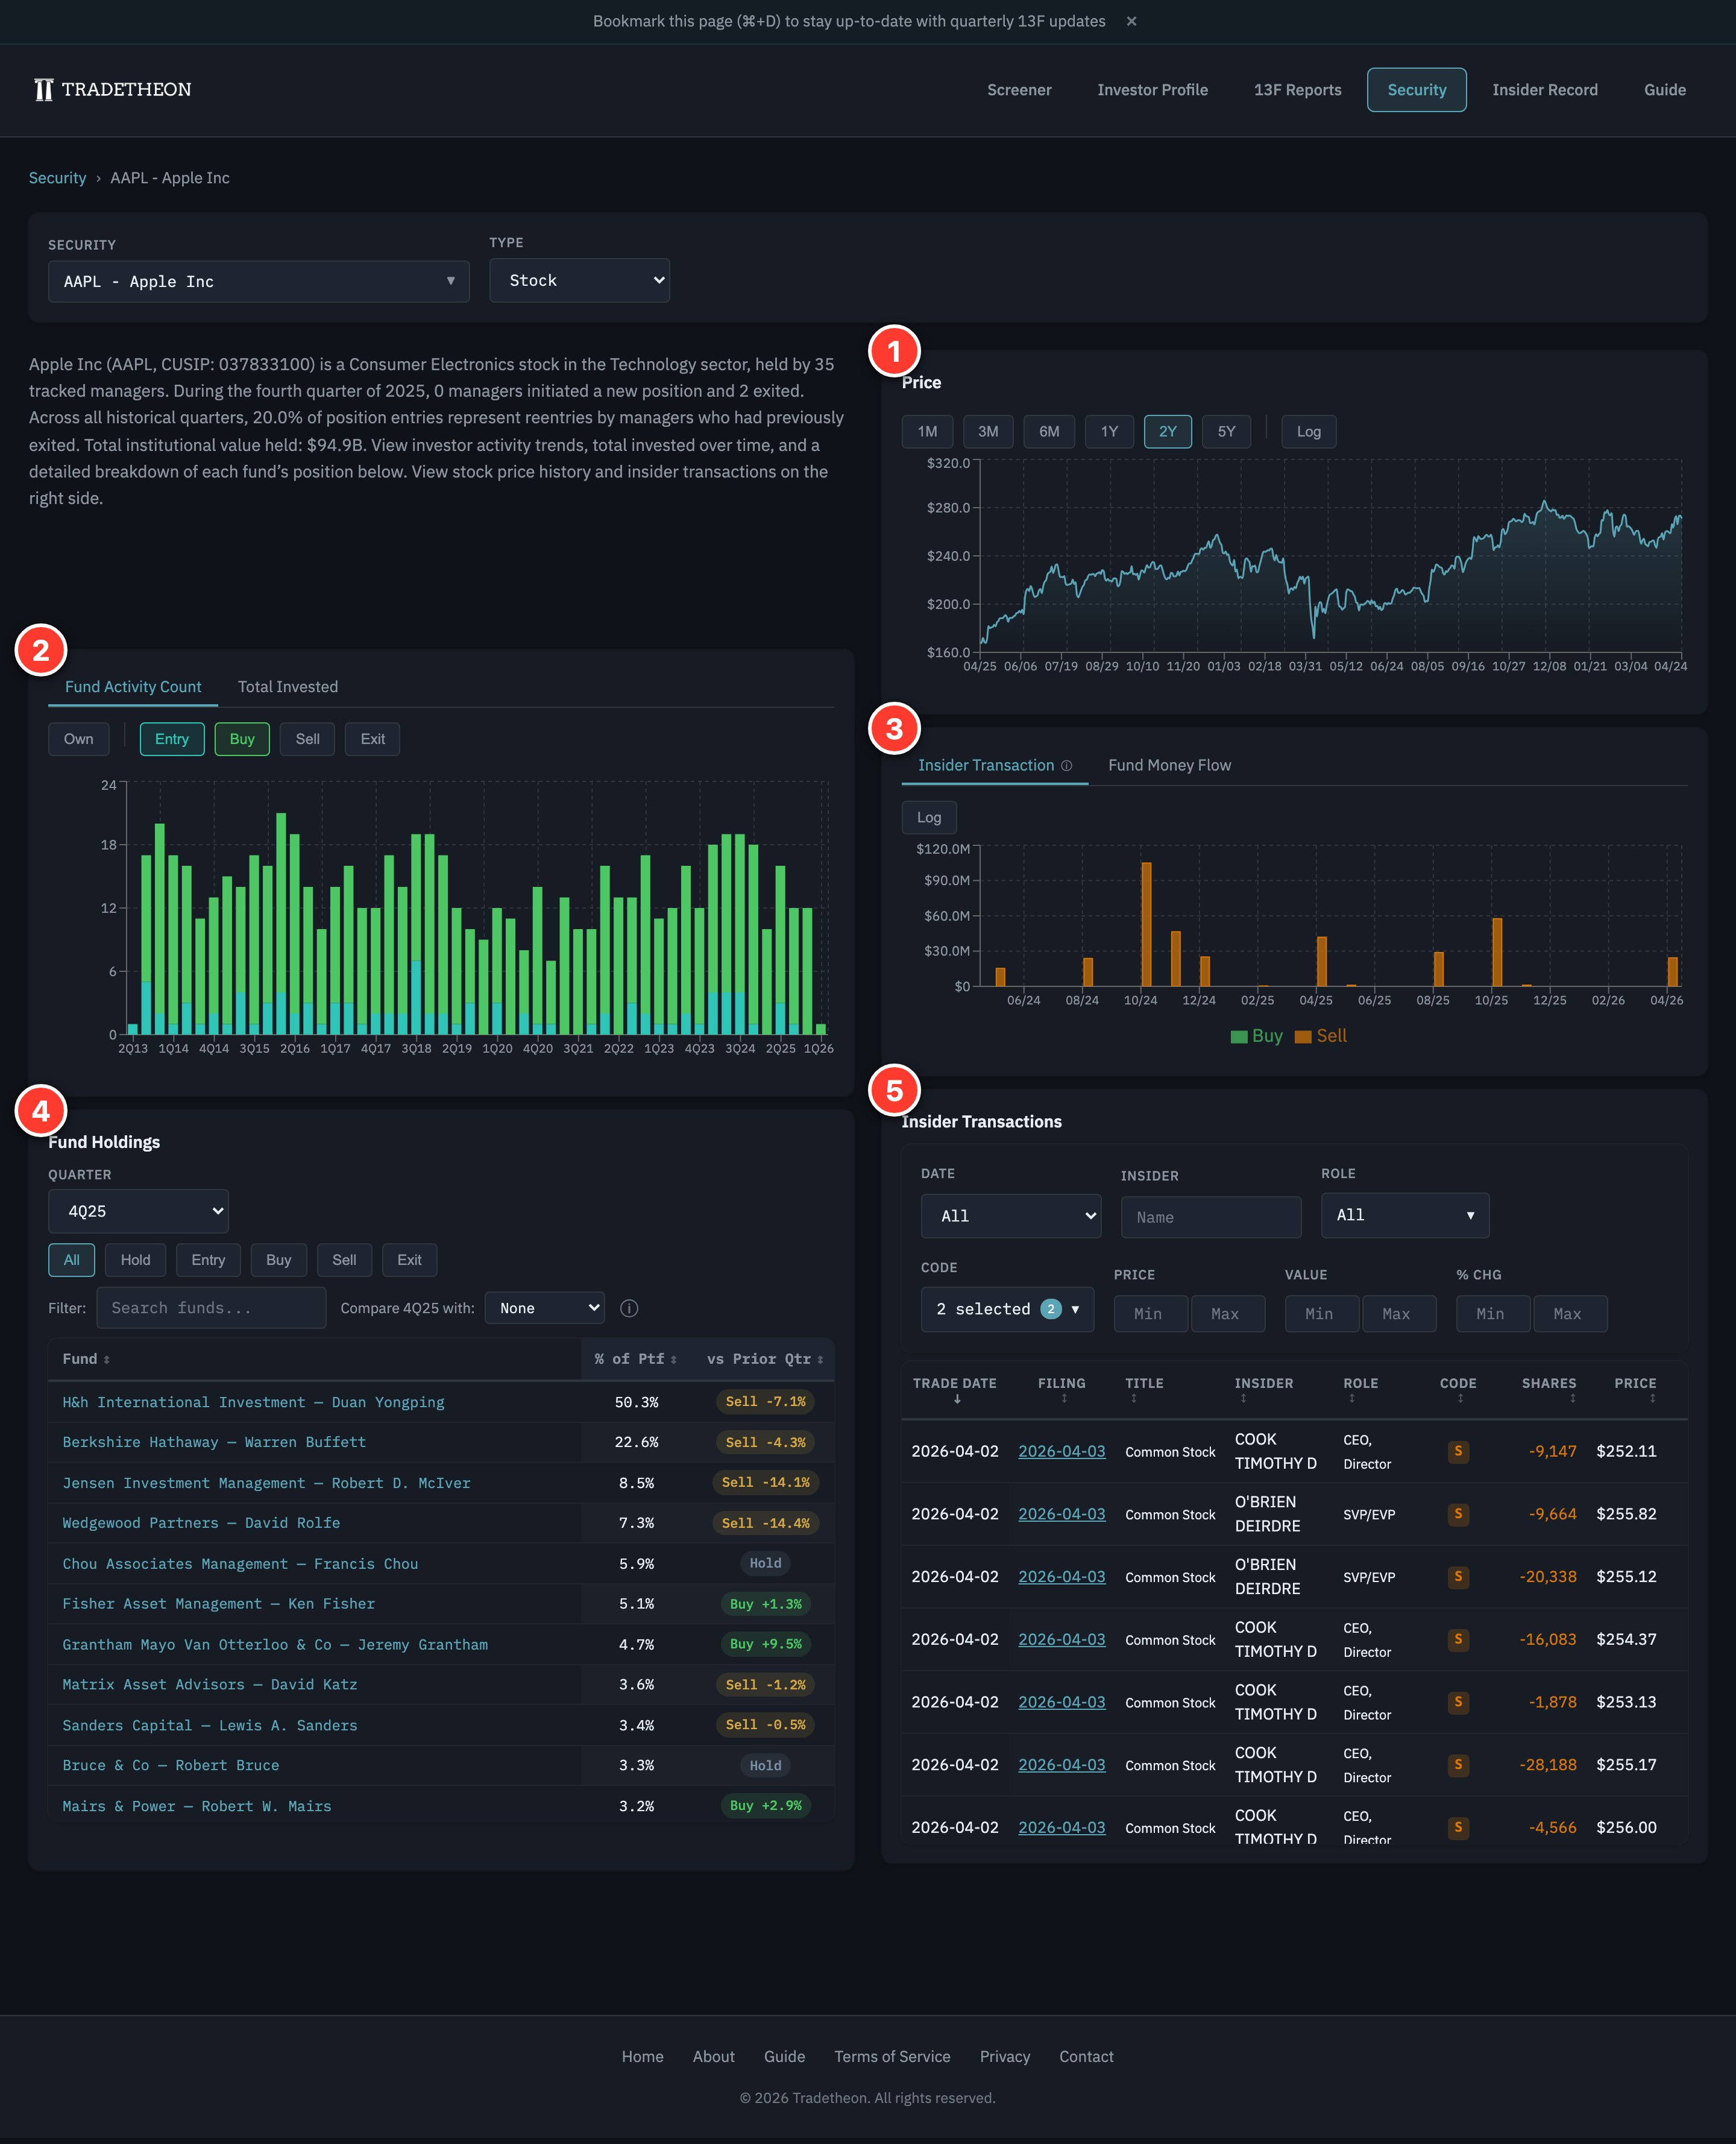
The page is organized into five regions:
- Price — the security's split-adjusted price history. Use the time-range buttons (1M through 5Y, plus log scale) to align price moves with the activity charts below — useful for asking whether tracked managers were accumulating, distributing, or holding through specific drawdowns or rallies.
- Fund Activity Count — a quarter-by-quarter count of how many tracked managers entered, added, held, trimmed, or exited the security. Rising green bars indicate a wave of institutional accumulation; rising red bars indicate distribution. The tab switches to Total Invested, which captures the same phenomenon in dollar terms: is informed capital flowing into this name, or draining out of it?
- Insider Transaction — a quarter-by-quarter view of officer and director activity in the security. The tab switches to Fund Money Flow, which shows the net dollar flow from tracked managers each quarter. See Insider Transactions: The Basics for how to read insider activity.
- Fund Holdings — the table of every tracked manager holding the security, sorted by portfolio weight. You can filter by activity type (Entry, Buy, Hold, Sell, Exit) and compare across quarters — the same toolkit available on the manager holdings page, but flipped to the security's perspective.
- Insider Transactions — a detail table of all reported officer and director buys and sells, with date, role, share count, price, and percentage change in holdings.
If five managers you respect all own the same name, that clustering of informed capital is a research signal worth investigating. It doesn't mean they're right — these managers can all be wrong at the same time (remember Valeant and Kraft Heinz? Valeant misled investors about its accounting and pricing practices, and Buffett later admitted Berkshire overpaid for Kraft Heinz.) — but it narrows the universe of 4,000+ U.S. stocks to the ones that multiple sophisticated investors are actively backing.
Research supports this approach: a study of systematic 13F-following strategies found that combining conviction (concentrated positions) with consensus (multiple managers converging) outperformed the S&P 500 by 3.8% annualized between 2004 and 2019. The key insight: manager selection matters enormously. Strategies focused on long-term, concentrated managers outperformed those that followed active traders.[3]
The Screener: where signals converge
The Screener operationalizes the research above into a practical tool. Rather than manually checking each manager's filing and cross-referencing securities, the Screener surfaces stocks where multiple signals align:
- Institutional Accumulation: multiple tracked managers adding to the same stock in the same quarter
- Superinvestor New Position: a new entry by a high-conviction manager — especially meaningful when the manager runs a concentrated portfolio
- Top 50 Bet: a stock appearing as a top position across multiple portfolios, indicating it's not just owned but heavily weighted
- Institutional Disposal: net selling by tracked managers, filtered to exclude net-purchasers so only genuine reductions surface
- Exit Position: a tracked manager fully closing a previously held position — a stronger conviction signal than a partial trim
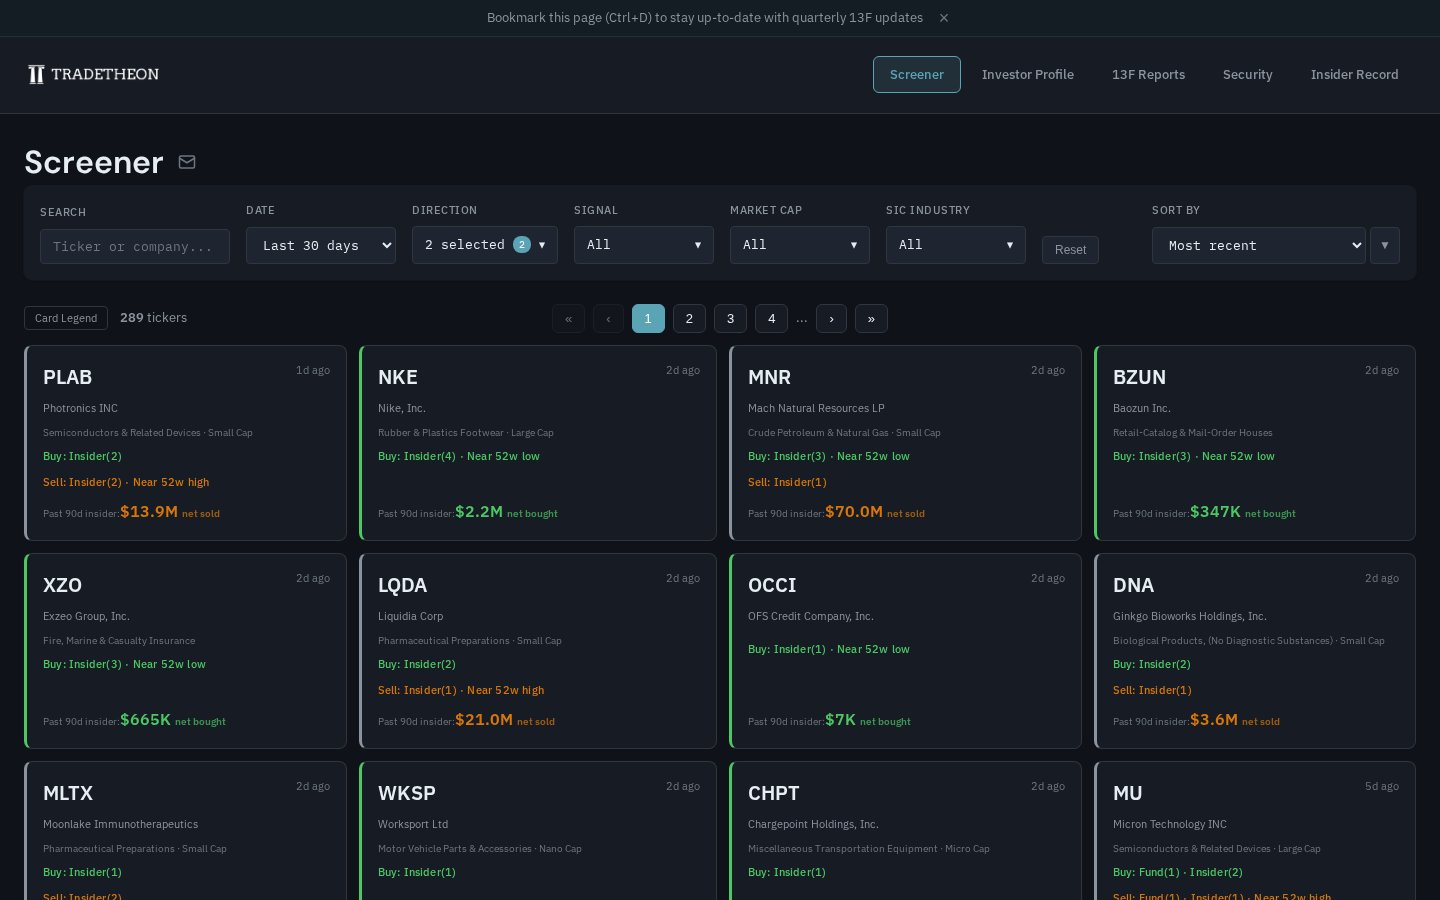
Each card summarizes one ticker: Buy and Sell signal counts (with insider vs. fund breakdowns), price proximity flags such as Near 52w low/high, and the past-90-day insider net dollar flow. For the full card anatomy and a complete signal glossary, see the Overview.
The Screener does two things simultaneously: it surfaces timely opportunities (stocks where informed capital is flowing in) and filters out untimely positions (stocks where institutional money is moving the other direction).
What a 13F can't tell you
The map is not the territory. 13F data is a useful model of what sophisticated investors own, but like all models, it has boundaries. Some limitations are structural — there's no workaround. Others can be partially mitigated with the right Tradetheon tool, which we flag below.
- You don't see short positions. A manager might own $500 million in tech stocks and be short $400 million against them. The 13F only shows the long side. A portfolio that looks aggressively concentrated might actually be hedged. There is no public filing that systematically discloses short positions.
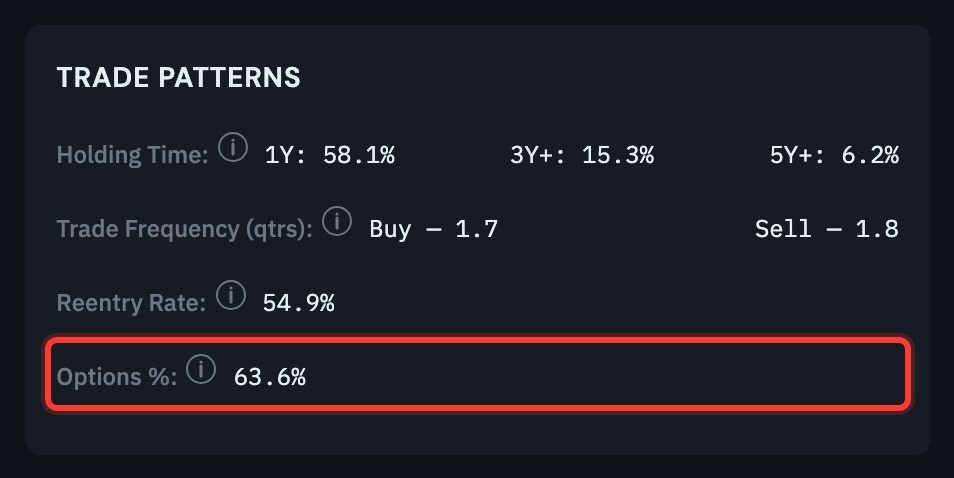
💡 Tip: Use the Options % metric as a proxy for hedged exposure
The Options % field on a manager's Trade Patterns panel shows what share of their book is options rather than common stock. Options are commonly used for hedging, so a higher Options % is a proxy for a higher likelihood that the manager carries short or hedged exposure the long-only 13F can't reveal. Citadel's book runs at 63.6% options — an extreme example, but it tells you their reported equity longs are part of a much larger hedged or relative-value structure.
-
You don't see cash. If a manager moved 40% of their portfolio to cash expecting a downturn, the 13F just shows smaller equity positions. You can't distinguish "sold to raise cash" from "sold to buy something else" without additional context.
-
You don't see bonds, most international stocks, or private holdings. 13F covers SEC-qualified securities — predominantly U.S.-listed equities, options, ETFs, and certain convertible instruments. A manager with major positions in European markets or private companies will look artificially concentrated in U.S. stocks.
-
You can't directly calculate whether a manager made money on a trade. Because 13F filings report only quarter-end snapshots, you don't know what price a manager paid to enter a position or what price they received on exit.
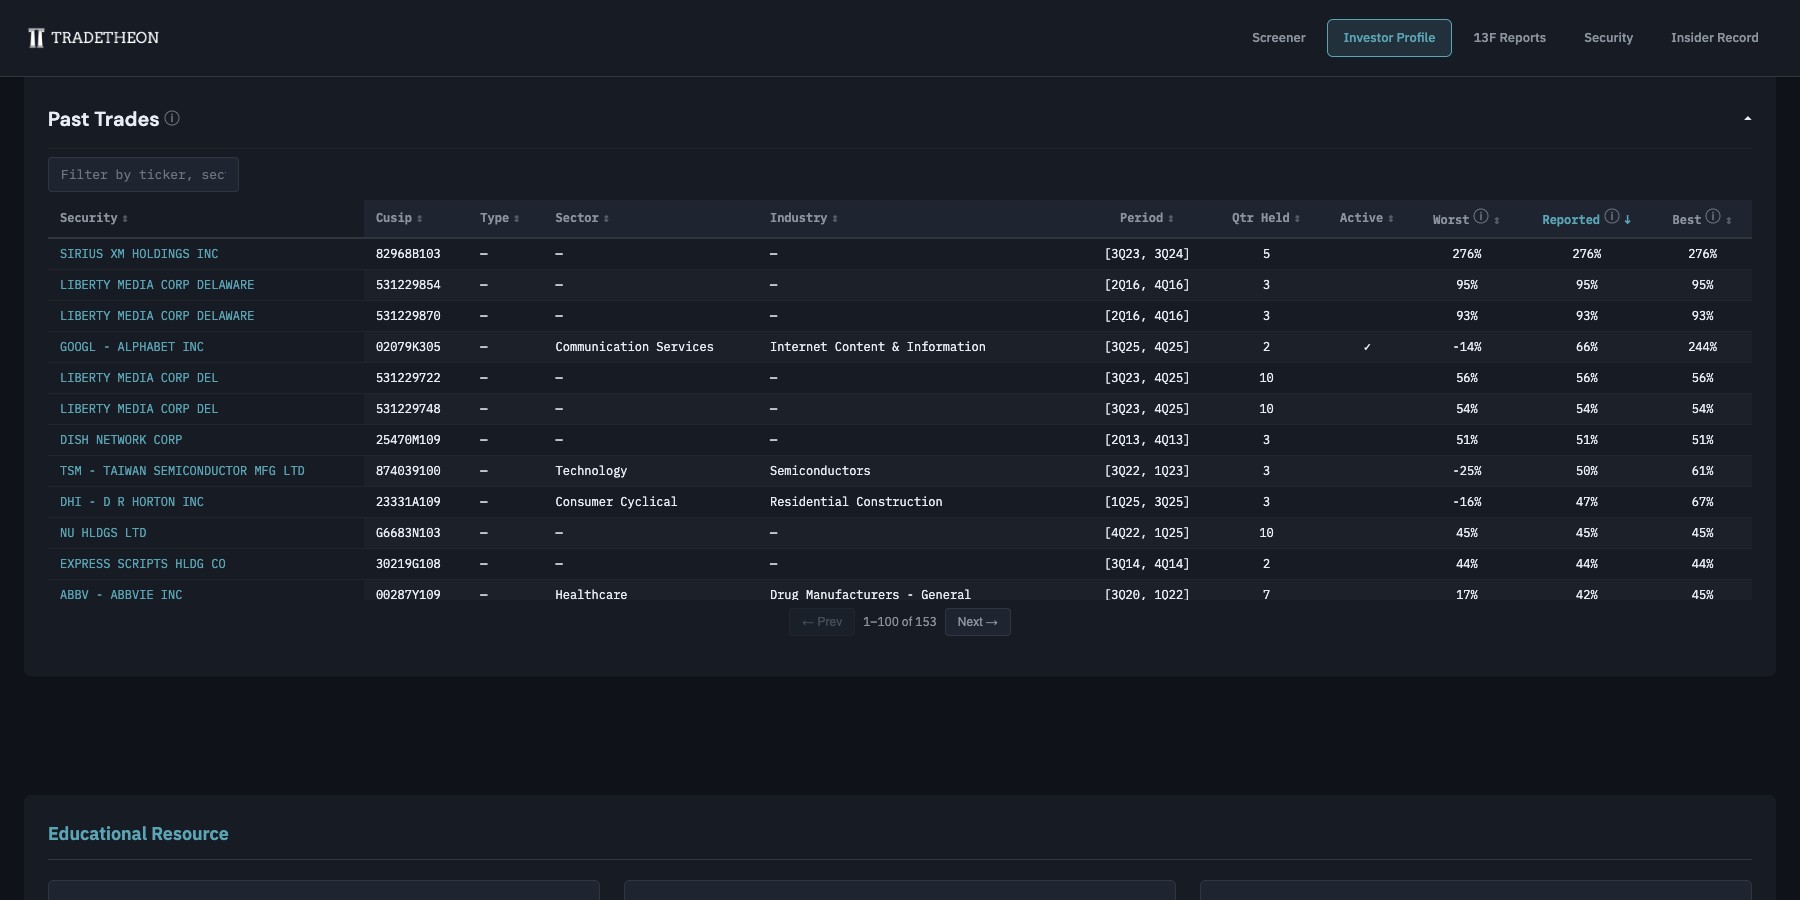
💡 Tip: Estimate the returns you couldn't observe with Worst/Best bounds
Performance estimation is still possible. By assuming a manager bought at the quarter's lowest price and sold at the highest (for the best-case return) — and vice versa for the worst case — you can derive a realistic range. Tradetheon does this on the Manager Dashboard's Past Trades table, showing "Worst" and "Best" possible returns where price data is available. When a position shows positive returns even in the worst case, that tells you something meaningful.
- The filing is delayed. Managers have up to 45 days after quarter-end to file. A snapshot from March 31 might not appear until mid-May. For long-horizon value managers this lag is manageable; for active traders it can render the data largely stale before you see it.
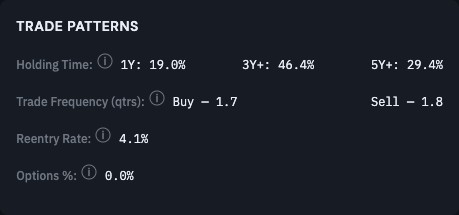
💡 Tip: Use holding period statistics to judge how much the 45-day lag matters
There's a common saying among value investors: "The stock always drops right after I buy it." Many of the managers Tradetheon tracks enter positions well before prices inflect, which means even a delayed view of their activity gives you a meaningful signal about where they see long-term value.
To help you assess how much the lag matters for any specific manager, Tradetheon calculates holding period statistics on each Manager Profile — the percentage of positions held for 1 year, 3+ years, and 5+ years. A manager whose 3+ year retention rate exceeds 70% is minimally affected by a 45-day delay. An active trader turning over most of the portfolio quarterly may have already reversed positions by the time you see the filing.
Going deeper
A caveat on holding statistics: many businesses don't survive as public companies in the long run. Doidge, Karolyi, and Stulz found that from 1997 to 2012, the U.S. had 8,327 delistings — and 4,957 of them (roughly 60%) were mergers and acquisitions, not business failures.[4] Some investors specialize in "workouts" — arbitrage situations, spin-offs, and merger targets — where positions are designed to be short-lived. Their holding period statistics may understate their actual long-term orientation when it comes to their core equity holdings.
-
Intra-quarter trades are invisible. If a manager bought and sold the same stock within a single quarter, neither transaction appears in the 13F. The filing only captures what's held on the last day. For multi-year-horizon investors this is a non-issue; for quantitative managers like Renaissance Technologies, whose average holding period is reportedly measured in days, the 13F tells you almost nothing useful.
-
Confidential treatment can hide positions. Managers can petition the SEC for "confidential treatment" — permission to temporarily withhold positions they're still building. Berkshire used this during its Apple and OXY accumulations. The initial filing is incomplete; later amendments reveal additional shares. This means a filing may be understating a manager's actual exposure when first published.
💡 Tip: Use the restatement rate to anticipate confidential-treatment amendments
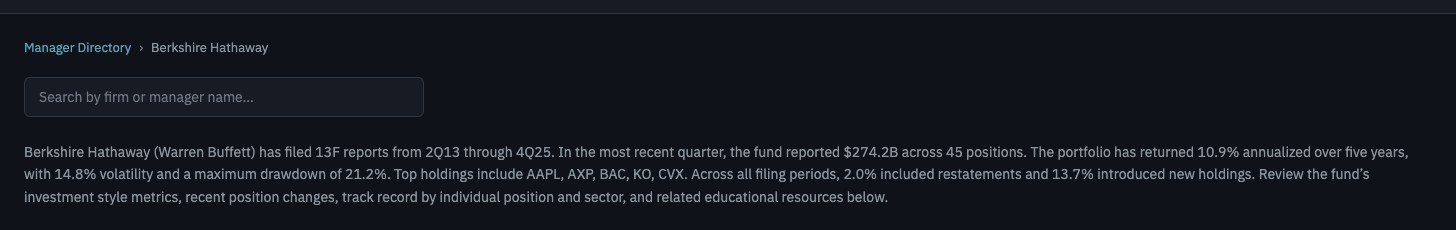
Each Manager Profile page includes a paragraph with the manager's new filing rate and restatement rate — a proxy for how frequently their initial disclosures are incomplete and later amended. A high restatement rate is a flag that the manager's first filing of each quarter should be treated as provisional.
What about institutional sales?
Insider sales and institutional sales are fundamentally different signals, and one of the most common mistakes in this space is to conflate them and dismiss both.
Insider sales, on average, are mostly noise — executives sell for dozens of personal reasons unrelated to the business (see Insider Transactions: The Basics for the nuances, including when insider sales do matter). But institutional sales carry substantially more information than people assume, precisely because fund managers' motivations are narrower. A fund manager sells for essentially four reasons: they made a mistake in their original analysis, an unfavorable change occurred in the business or industry, they believe the stock has become overvalued, or they've found a better opportunity for the capital.
Only the last reason — redeploying capital to a better opportunity — produces a genuinely noisy signal. The first three all carry real information about the manager's assessment.
Tradetheon flags institutional disposals when a manager has net-sold their position during the reported quarter. In the Screener, we filter out managers who were net-purchasers from the Institutional Disposal signal, so what surfaces are genuine reductions — not small trims offset by other buying. The Exit Position signal goes further, flagging full position closures.
Consider Berkshire Hathaway's Apple position. Buffett has repeatedly called Apple one of Berkshire's best investments and publicly stated his intention to hold it indefinitely. When his filings began showing sustained selling — quarter after quarter of reducing the position, without redeploying the proceeds into new or existing equity positions — that pattern signals something meaningful. It suggests Buffett's view of Apple's long-term economics or valuation may be shifting, despite his public statements.
This is the kind of insight that emerges from watching what managers do rather than what they say.
Going deeper
The academic evidence on institutional sales is less developed than for insider purchases, but that doesn't mean the signal is weak — only that it's less studied. Nofsinger and Sias (1999) found that stocks institutional investors buy subsequently outperform those they sell, and that herding by institutions has meaningful price impact — suggesting that when multiple funds independently reach the same conclusion, the market eventually follows.[5] Tradetheon's approach of flagging only net-sold positions helps separate discretionary conviction changes from routine portfolio adjustments.
Next: Insider Transactions: The Basics →
Sources
[1] SEC. "Official List of Section 13(f) Securities." → SEC FAQ
[2] SEC. "Frequently Asked Questions About Form 13F." → SEC FAQ
[3] Angelini, M., Iqbal, F., & Jivraj, F. (2019). "Systematic 13F Hedge Fund Alpha." SSRN Working Paper. → Paper
[4] Doidge, C., Karolyi, G. A., & Stulz, R. M. (2017). "The U.S. Listing Gap." Journal of Financial Economics, 123(3), 464–487. → Paper
[5] Nofsinger, J. & Sias, R. (1999). "Herding and Feedback Trading by Institutional and Individual Investors." Journal of Finance, 54(6), 2263–2295. → Paper