Understanding Institutional & Insider Data
A study by Martin and Puthenpurackal (2008) asked a simple question: what if you just copied Warren Buffett? Not in real time — that's impossible — but using his publicly disclosed 13F filings, which arrive with a 45-day delay. Their finding: Berkshire Hathaway generated 11.14% annual abnormal returns above the S&P 500 over their 1976–2006 study window, and a hypothetical portfolio that mimicked Berkshire's disclosed investments after the filings became public still earned 10.75% annual abnormal returns.[1]
The gap between 11.14% and 10.75% is remarkably small. Nearly all of Buffett's edge was preserved even when replicated by strangers reading a filing a month and a half late. The data was free. The strategy was mechanical. The edge came from paying attention to what the best investor in the world was telling the market, in plain sight, every quarter.
Every quarter, several thousand institutional managers disclose their U.S. equity holdings to the SEC. Every day, corporate insiders report their stock purchases and sales. Tradetheon processes these regulatory filings into a research platform built around three principles:
Signal over noise. Rather than dumping every filing onto a screen, we filter for the patterns that academic research and investment practice show are most informative — institutional accumulation, insider cluster buys, significant executive purchases. Less data, more insight.
Design that sustains focus. From chart layouts to table structure, the platform is built to reduce cognitive strain and surface what matters. Dark theme for extended reading sessions, color-coded activity badges, sortable columns, and focused data views that don't overwhelm.
Research-backed, not black-boxed. Our signals are grounded in published academic research and sound mental models — not proprietary scoring no one can audit. Where peer-reviewed evidence exists, we cite it so you can evaluate it yourself. Where a signal rests on reasoning rather than empirical studies, we say so plainly.
The approach has academic backing beyond just Buffett. Bruce Greenwald, professor at Columbia Business School, identifies 13F filings and insider transactions as indirect information sources in the research strategy chapter of Value Investing: From Graham to Buffett and Beyond — a foundational text in the value investing curriculum.
What you can do with it
💡 Tip: Three entry points — source ideas with the Screener, study investors with the Manager Dashboard, research a specific stock with the Security page and Insider Record.
Source investment ideas
"Don't tell me what you think, show me your portfolio." — Nassim Nicholas Taleb
Skin in the game is the ultimate filter. When a fund manager stakes billions on a position, or when a CEO writes a personal check for company stock, they're telling you more than any analyst report or earnings call ever could. The Screener is the tool that surfaces these moves.
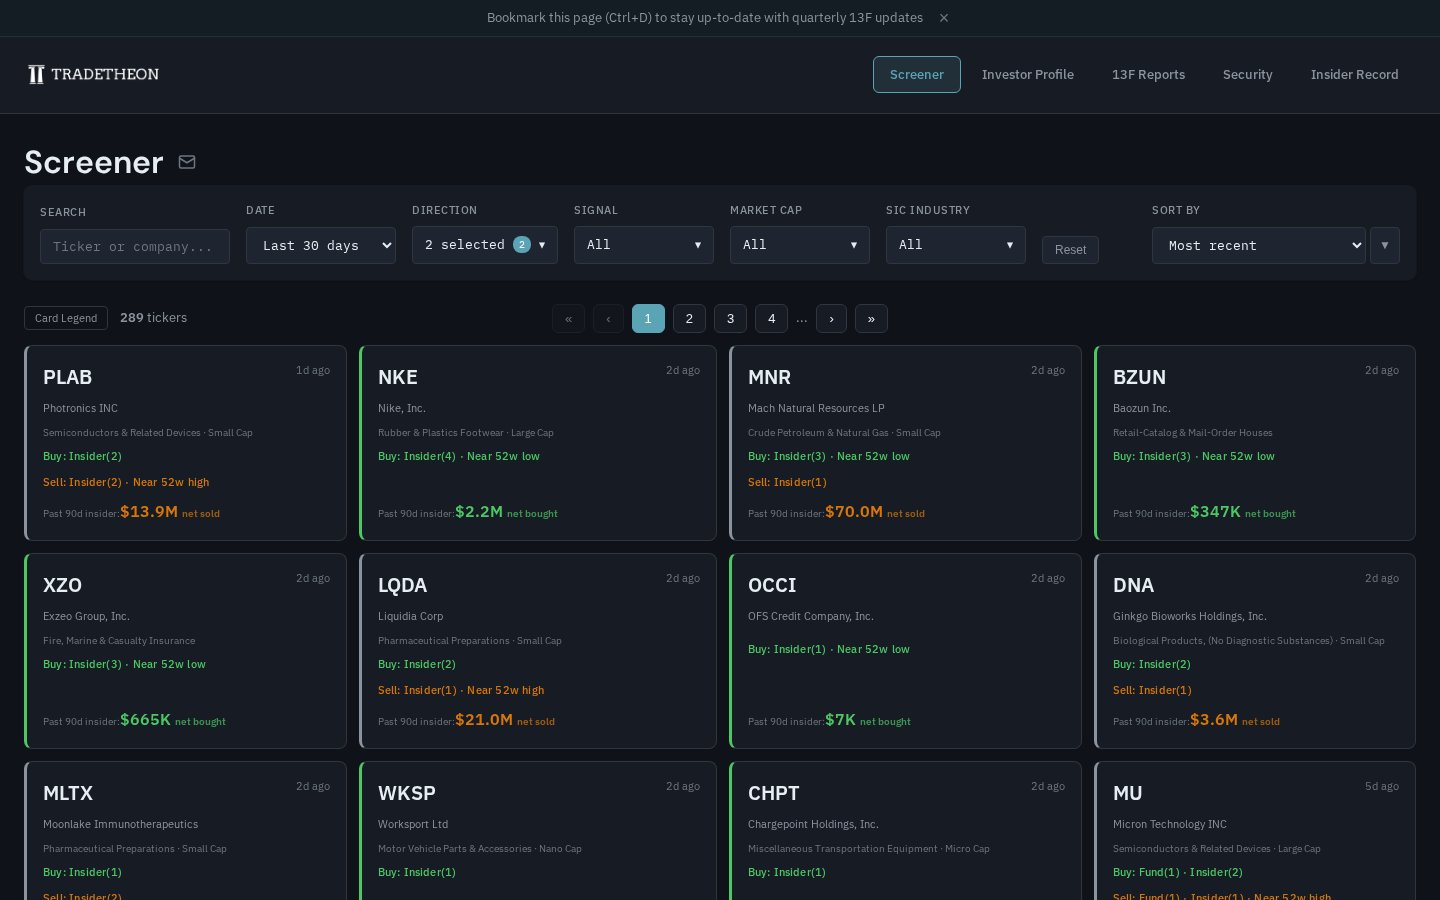 Note the filter row at top, the card grid below, and the Card Legend button in the toolbar. See it live →
How it narrows the universe
- The universe starts at ~4,000 U.S. stocks tracked across ~111 institutional managers and thousands of corporate insiders.
- The default view narrows to tickers with fund OR insider activity in the last 30 days — so you're not scrolling all 4,000 stocks, you're seeing only the ones where someone with skin in the game just acted.
- Filters then narrow further by direction, signal type, market cap, and industry. Sort to surface what you care about.
Filter reference
- DATE — time window for the activity shown (Last 7 / 30 / 90 days, 6 months, 1 / 2 / 3 / 4 / 5 years).
- DIRECTION — Buy signals only, Sell only, or both.
- SIGNAL — specific signal types (listed in the glossary below).
- MARKET CAP — Nano / Micro / Small / Mid / Large.
- SIC INDUSTRY — industry filter (e.g., Semiconductors, Pharmaceutical Preparations).
- SORT BY — Signal count · 90-day insider buy · 90-day insider sell · 90-day insider net · Most recent · Nearest 52w low · Nearest 52w high · Max fund weight · Avg fund weight (≥2%).
Signal glossary
Every signal surfaced on the Screener is defined below in one sentence. For deeper explanations — research backing, interpretation, and limitations — see the 13F Filings and Insider Transactions guides.
Buy signals — fund-side:
- Superinvestor New Position — A tracked superinvestor initiated a new position with at least 2% portfolio weight.
- Institutional Accumulation — A tracked fund increased its position with at least 2% portfolio weight.
- Top 50 Bet — This ticker ranks among a tracked superinvestor's top 50 highest-conviction bets.
Buy signals — insider-side:
- Cluster Buy — 2 or more insiders each purchasing $25K+ of shares within a 30-day window.
- C-Suite Buy — A CEO, CFO, COO, or President purchased $25K+ of shares on the open market.
- First-Time Buyer — An insider made their first open-market purchase ($25K+) at this company.
- Significant Buy — An insider purchased $100K+ of shares or increased holdings by 20%+.
- Derivative Buy — An insider made a bullish derivative trade (e.g., buying calls or selling puts).
- Penny Stock Buy — An insider purchased $10K+ (C-Suite/Director) or $100K+ (others) of a stock trading below $5.
Sell signals — fund-side:
- Exit Position — A tracked superinvestor who was a net seller for the quarter fully exited a position previously held at 2%+ portfolio weight.
- Institutional Disposal — A tracked fund that was a net seller for the quarter reduced a 2%+ conviction position by at least 25% of shares held.
Sell signals — insider-side:
- Cluster Sell — 3 or more insiders sold $500K+ of shares in aggregate within a 30-day window.
- Significant Sell — An insider disposed of 25%+ of holdings worth at least $1,000,000.
Price signals:
- Near 52w Low — Current price is within 25% of its 52-week low.
- Near 52w High — Current price is within 25% of its 52-week high.
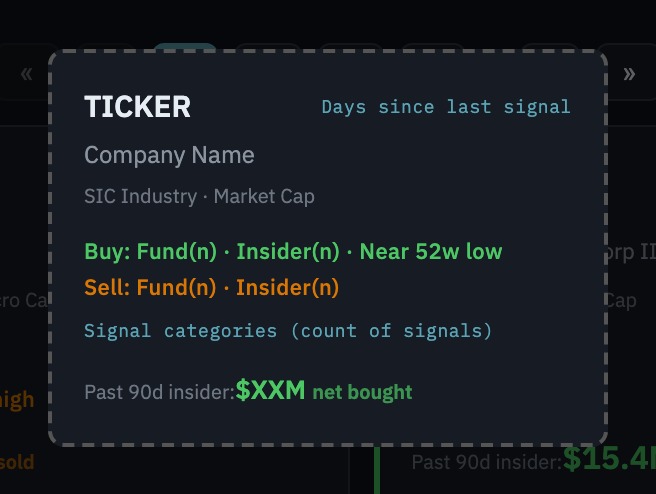
How to read a ticker card
Each card in the grid summarizes one ticker's recent activity. Here's what each line means:
 The same reference is available in-product via the Card Legend button in the toolbar.
- Top row — Ticker symbol (left) + days since the latest signal (right).
- Company — Full legal name, then SIC industry · Market Cap tier.
- Buy line (green) — Buy signals that fired.
Fund(N)is the count of distinct fund-side signal categories;Insider(N)is the count of distinct insider-side signal categories. Price signals likeNear 52w loware shown inline. - Sell line (red/orange) — Same format for sell-side signals.
- Bottom row — Past 90-day insider net dollar flow: the sum of insider open-market purchases minus sales over the last 90 days. A large figure means the recent insider activity was material in dollar terms, not a token trade.
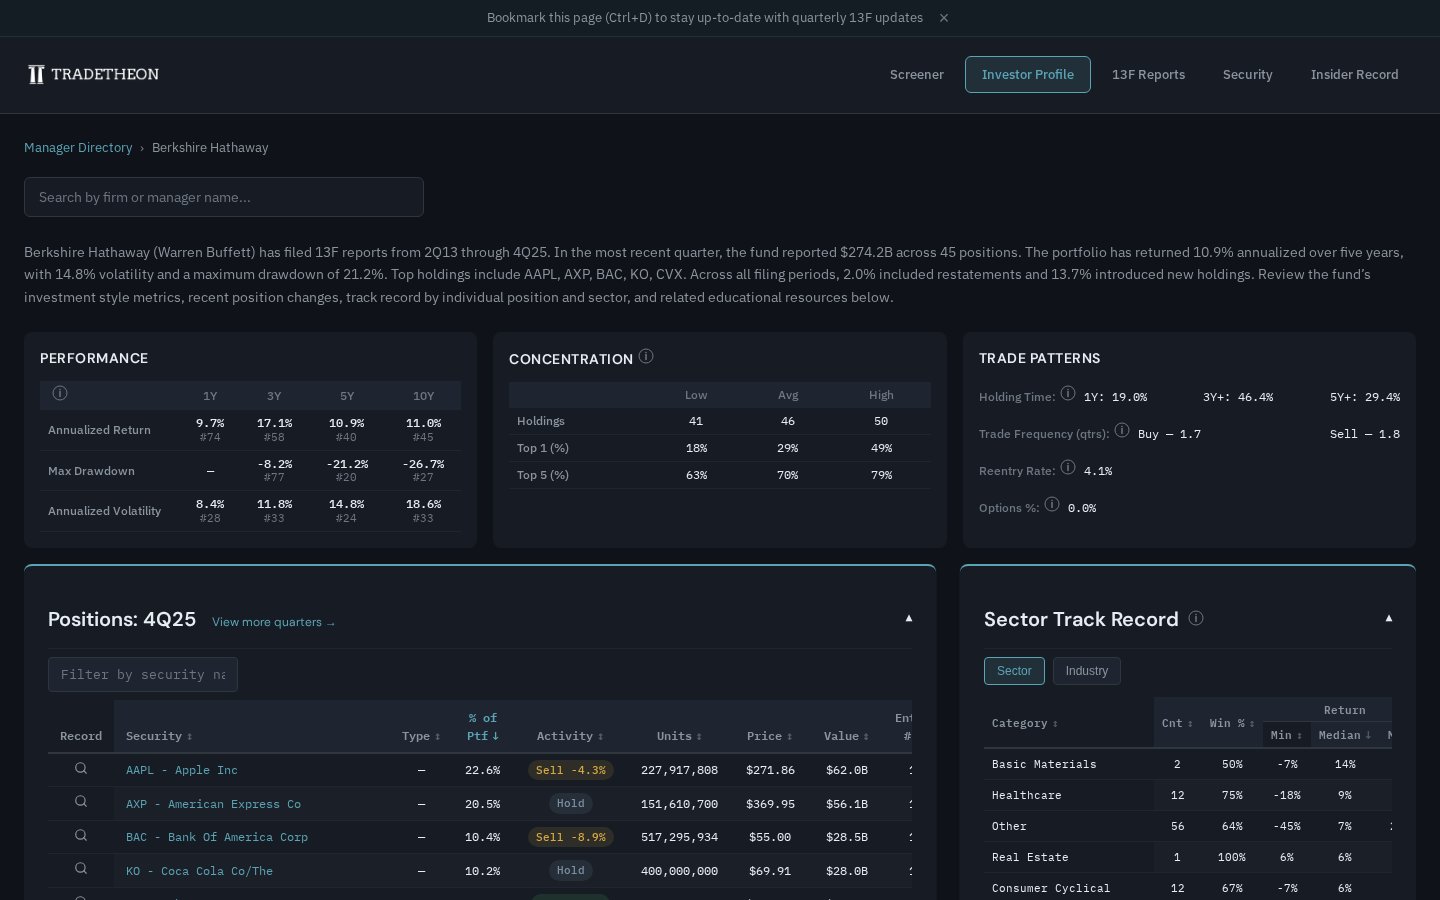
Study the best investors
Learning from superinvestors works the same way learning works in any field. A young soccer player doesn't invent their own technique from scratch — they study Messi's movement, Ronaldo's positioning, and adapt what works to their own game.
Manager Dashboard pages let you study how each fund operates: portfolio concentration, holding periods, sector track record, and historical returns. But the key insight is that it's not just who you study — it's how. Many superinvestors are generalists with pockets of deep expertise. Buffett's track record in banking is near impeccable, while his bets on other industries, though impressive overall, are less consistent. Understanding where each manager's edge is sharpest helps you know which of their ideas deserve the most attention.
Research specific stocks
Once you've identified a ticker worth deeper study — whether from the Screener, a manager's portfolio, or your own watchlist — two pages let you see exactly what tracked managers and insiders are doing with it.
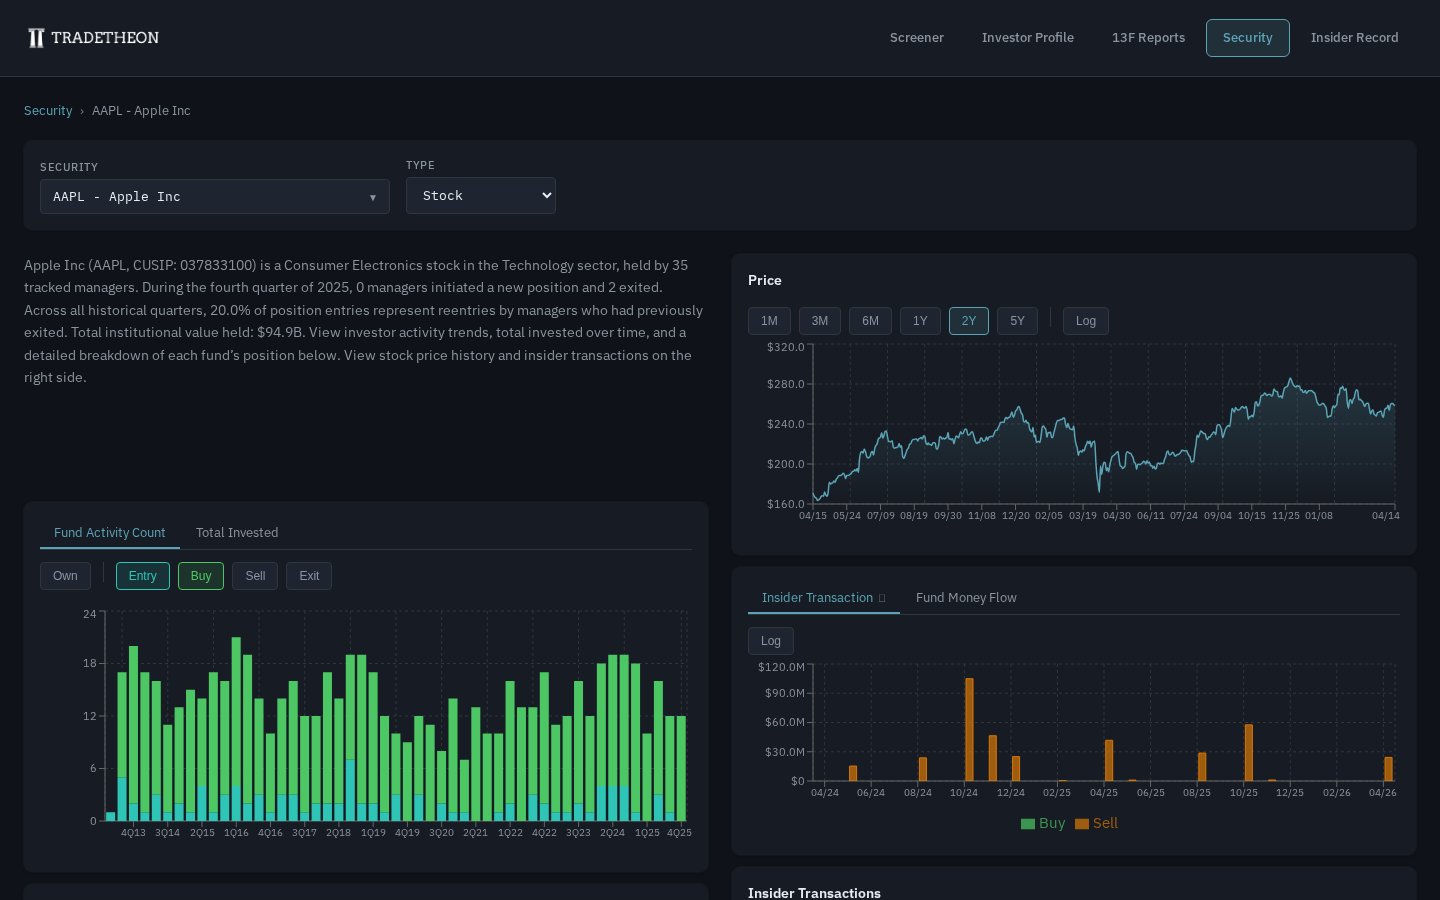
Security page
The Security page aggregates everything the platform knows about a single stock: price history, fund activity (Entry / Buy / Sell / Exit counts per quarter), total invested over time, insider transactions and fund money flow charts, and a detailed fund holdings table.
Use it when the question is: "I'm interested in AAPL — what are tracked managers and insiders doing with it right now?"
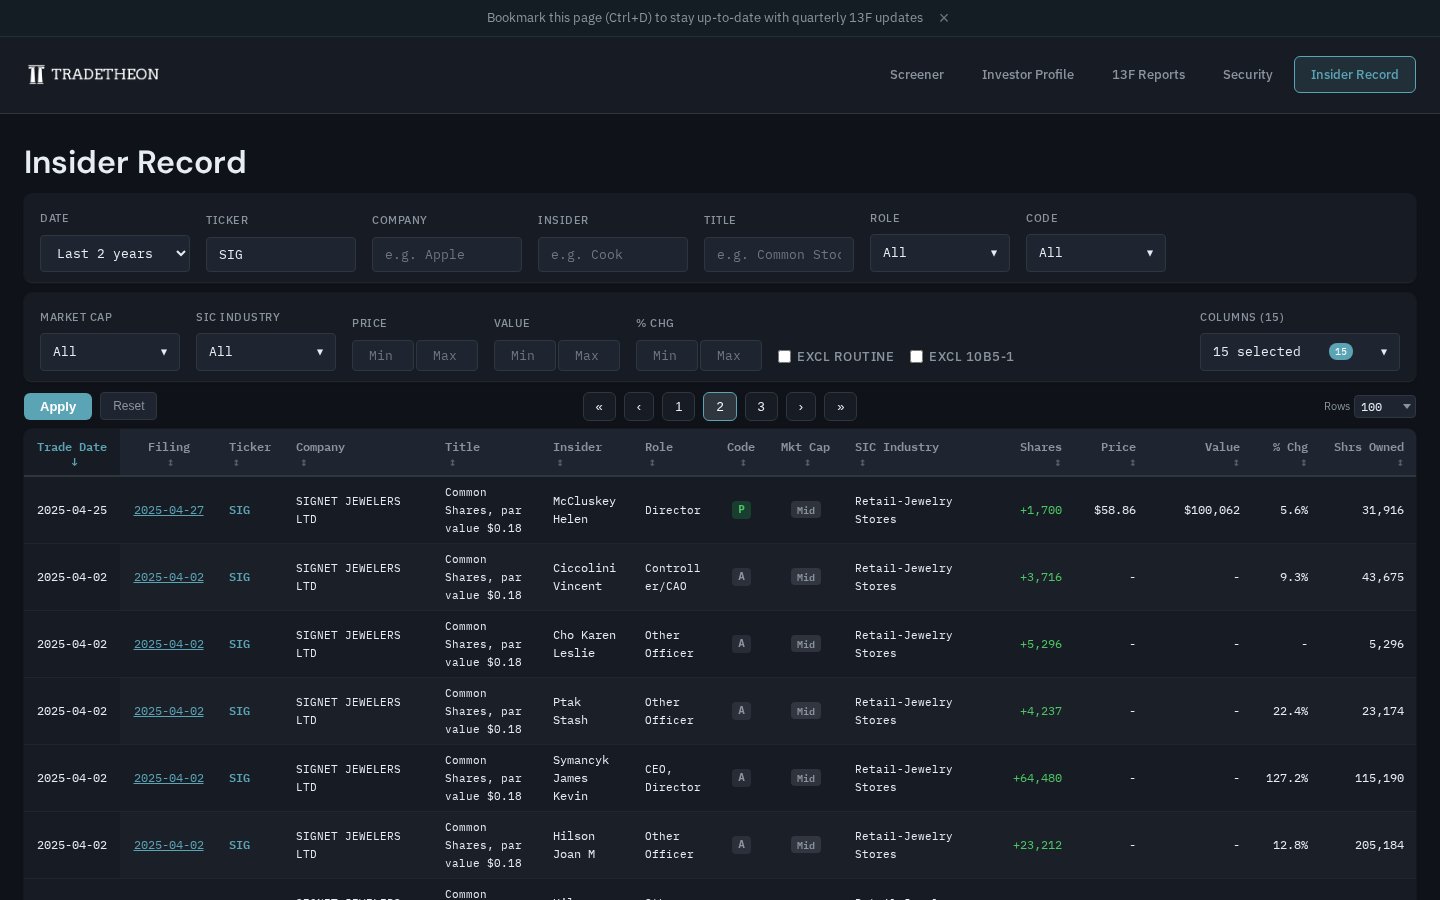
Insider Record
The Insider Record is a filterable table of every insider transaction in the dataset, with columns for role, transaction code, value, % change in holdings, and a link to the raw SEC filing. Filters include EXCL ROUTINE and EXCL 10B5-1 to strip out pre-scheduled or routine transactions that carry less signal.
Use it when the question is: "I want to see every insider trade for a specific ticker, insider, or role — raw details rather than aggregated signals."
How this guide is organized
13F Filings: The Basics
What institutional holdings data shows, what it hides, and how to read it on Tradetheon. Start here if you've ever wondered how people track what Warren Buffett is buying — and why a common mistake is to ignore investor sales when you shouldn't.
Insider Transactions: The Basics
When executives buy their own stock and why research shows it matters more than when they sell. How Tradetheon detects cluster buys, significant purchases, and the sale-side signals that warn of skin-in-the-game erosion — and how to circumvent the limitations of this data.
Sources
[1] Martin, G. & Puthenpurackal, J. (2008). "Imitation is the Sincerest Form of Flattery: Warren Buffett and Berkshire Hathaway." SSRN Working Paper. → Paper